pN = 500;
pW = 700;
pF = 1900;
datN = {x, y} = {RandomVariate[NormalDistribution[-10, 5], pN],
RandomVariate[NormalDistribution[-10, 5], pN]};
datN = Transpose[datN];
datW = {x, y} = {RandomVariate[WeibullDistribution[2, 5], pW] – 25,
RandomVariate[WeibullDistribution[2, 15], pW] – 20};
datW = Transpose[datW];
datG = {x, y} = {RandomVariate[GumbelDistribution[10, 4], pN],
RandomVariate[GumbelDistribution[10, 4], pN]};
datG = Transpose[datG];
datF = {x, y} = {RandomVariate[FrechetDistribution[2, 1.5], pF] – 25,
RandomVariate[FrechetDistribution[2, 1], pF] – 25};
datF = Transpose[datF];
xs = Join[Take[datN, All, {2, 2}], Take[datW, All, {2, 2}],
Take[datG, All, {2, 2}], Take[datF, All, {2, 2}],
Take[datW*-1, All, {2, 2}], Take[datF*-1, All, {2, 2}]];
ys = Join[Take[datN, All, 1], Take[datW, All, 1], Take[datG, All, 1],
Take[datF, All, 1], Take[datW*-1, All, 1], Take[datF*-1, All, 1]];
rec = Rectangle[{Min[ys], Min[xs]}, {Max[xs], Max[ys]}];
rec = Rectangle[{-30, -30}, {30, 30}];
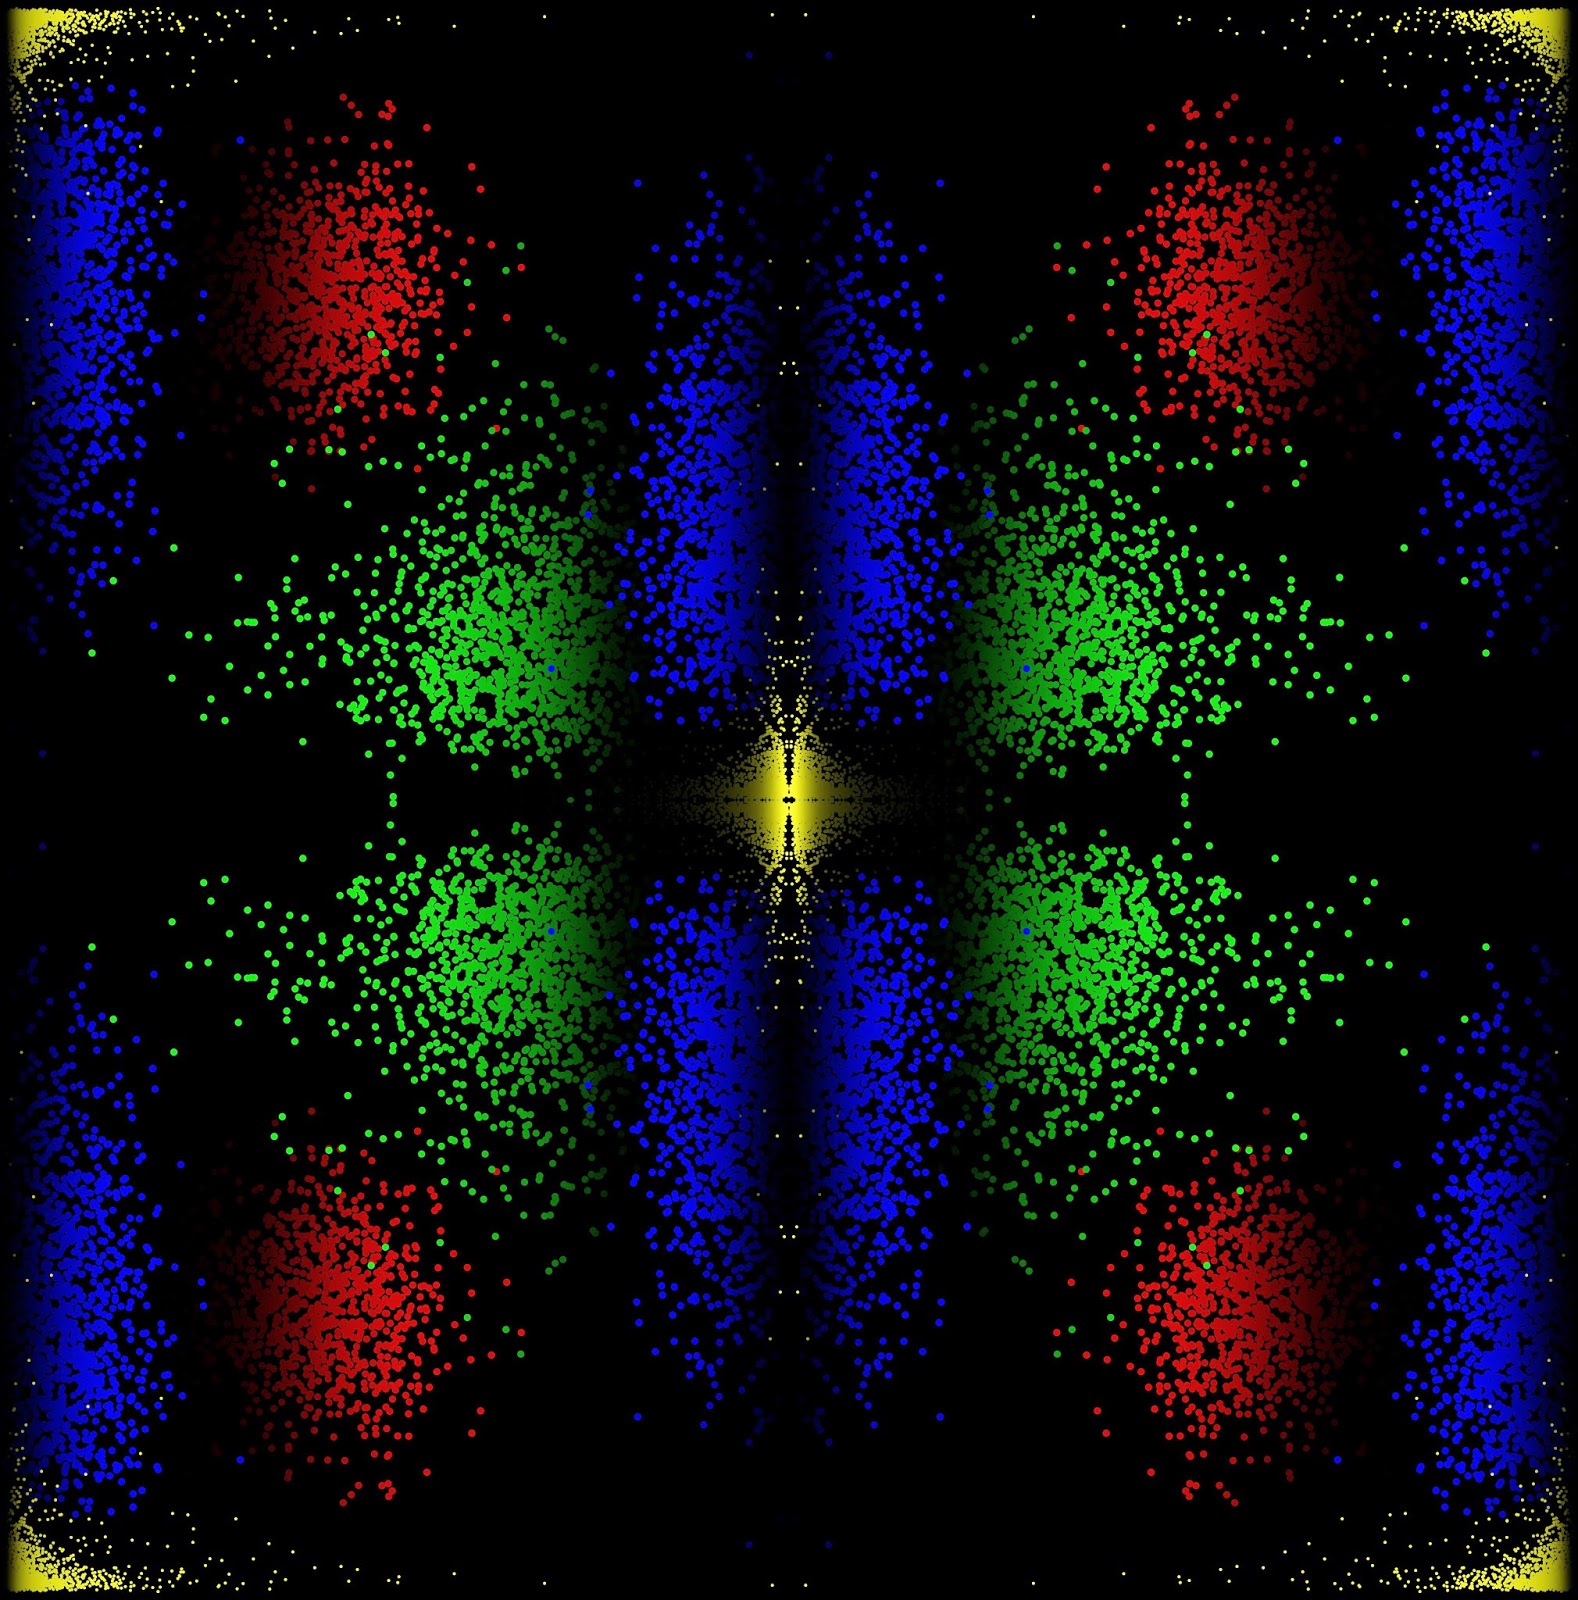
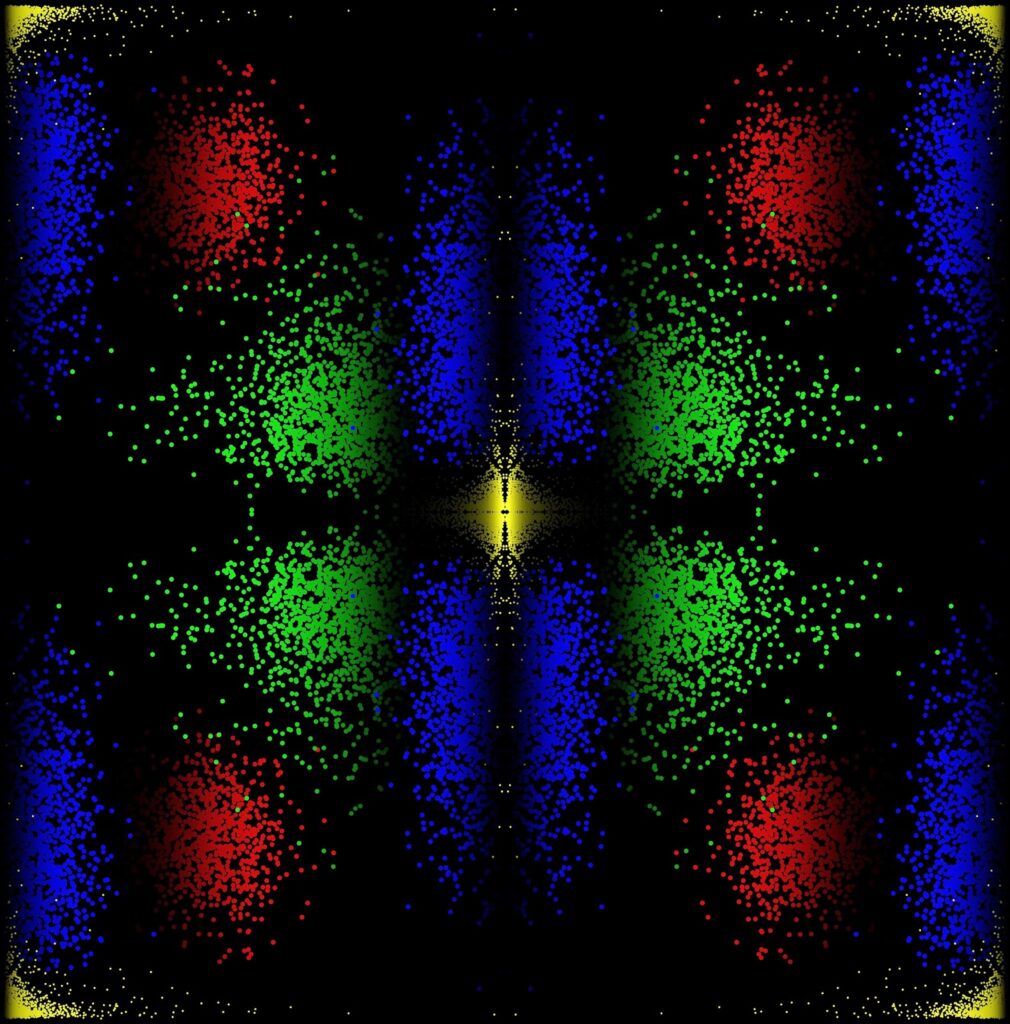
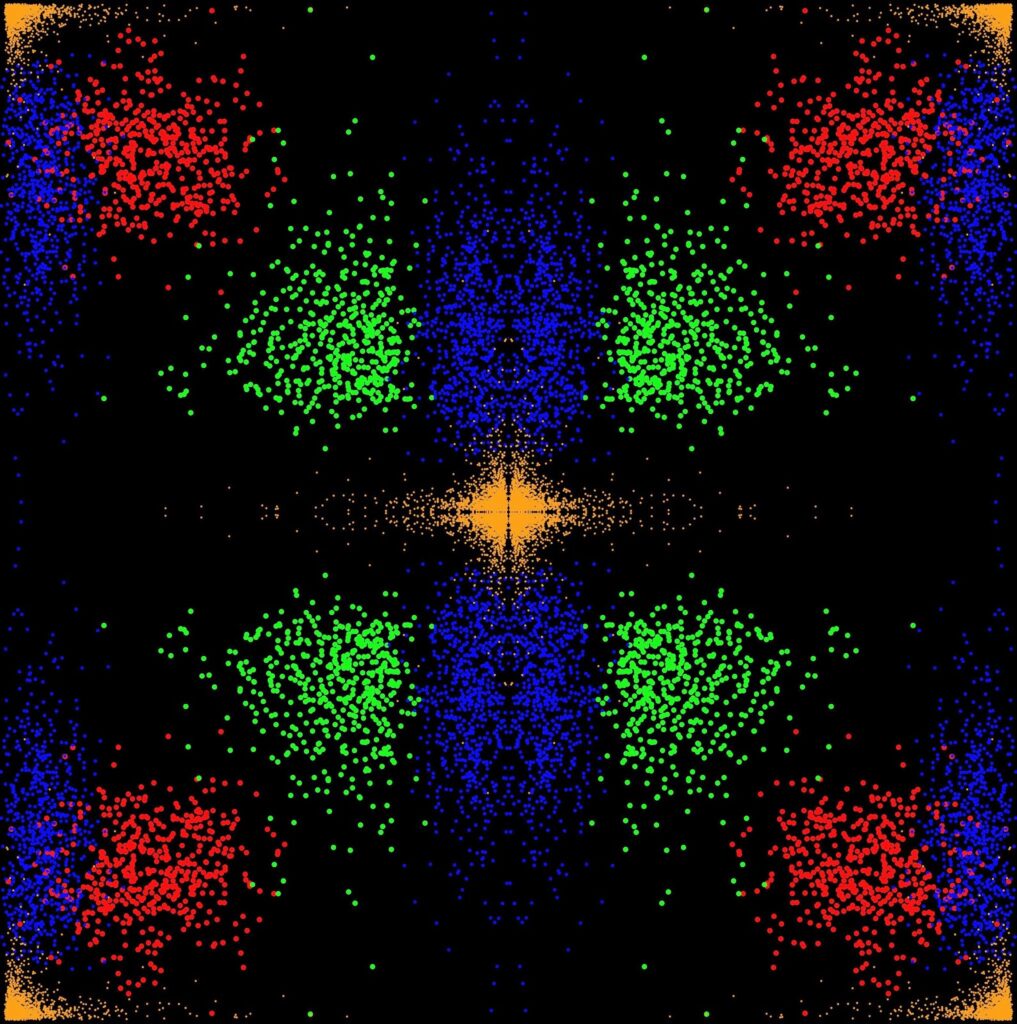
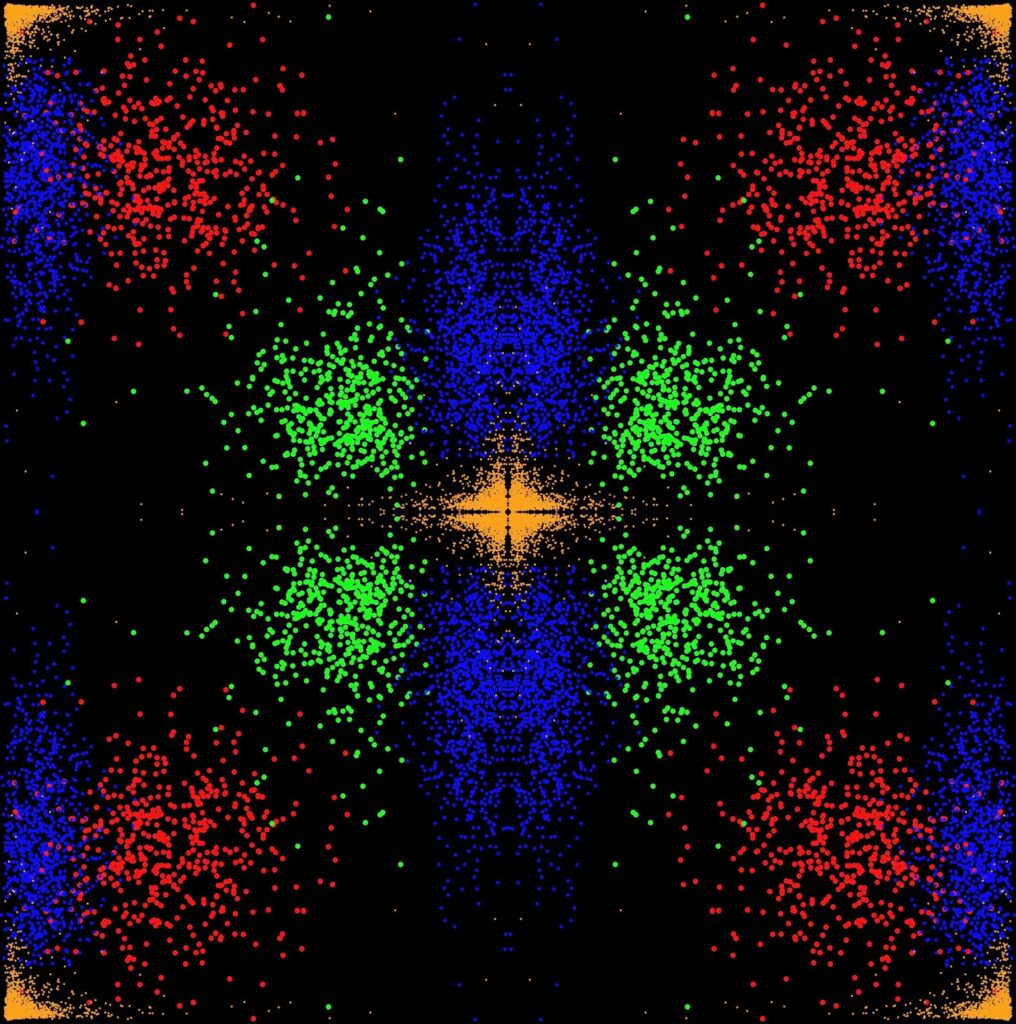
sg = Graphics[{rec
, {PointSize[0.008], Red, Point[datN]}
, {PointSize[0.005], Blue, Point[datW]}
, {PointSize[0.008], Green, Point[datG]}
, {PointSize[0.003], Orange, Point[datF]}
, {PointSize[0.005], Blue, Point[datW*-1]}
, {PointSize[0.003], Orange, Point[datF*-1]}
}]
Export[“~/something/something/art.eps”, sg, ImageSize -> {3000, 3000}]
Posted 11th July 2014 by Ozgur Keles